Data analysis, models, maps
Data analysis, visualisation, and consulting, programming and computational modelling, software and website development.
The header tabs show my current projects, publications, and presentations. Below are links to my digital footprint. Hit me on any of my channels for consulting, collabs, source code, or to chat about all things data.
Current
Project Manager, Data and Visualisation
Visual Stories Team at The Age and Sydney Morning Herald, Melbourne, Australia
- Data analysis and visualisation, open source programming, and mapping to build data-driven stories and digital content in the media landscape spanning environmental to politics to economics.
I also consult in data analysis/viz, have 12 years experience in copy-editing/proofing in research and academic publishing, teach programming in ‘R’ and run an online coding club, co-run a digital design studio, and dabble in e-commerce.
Previous
Research scientist — infectious disease modelling
Emory University, Atlanta, USA
Computational modeller — spatial and biosecurity risk mapping
Centre of Excellence for Biosecurity Risk Analysis, Melbourne, Australia
Topics
Data analysis, data science, data viz, stats, models, simulations, data pipelines, dashboards, UI/UX, rstats, research, maps, geospatial, API, opensci, rmarkdown, workshops, shiny, coding club, software
Tools


Latest post
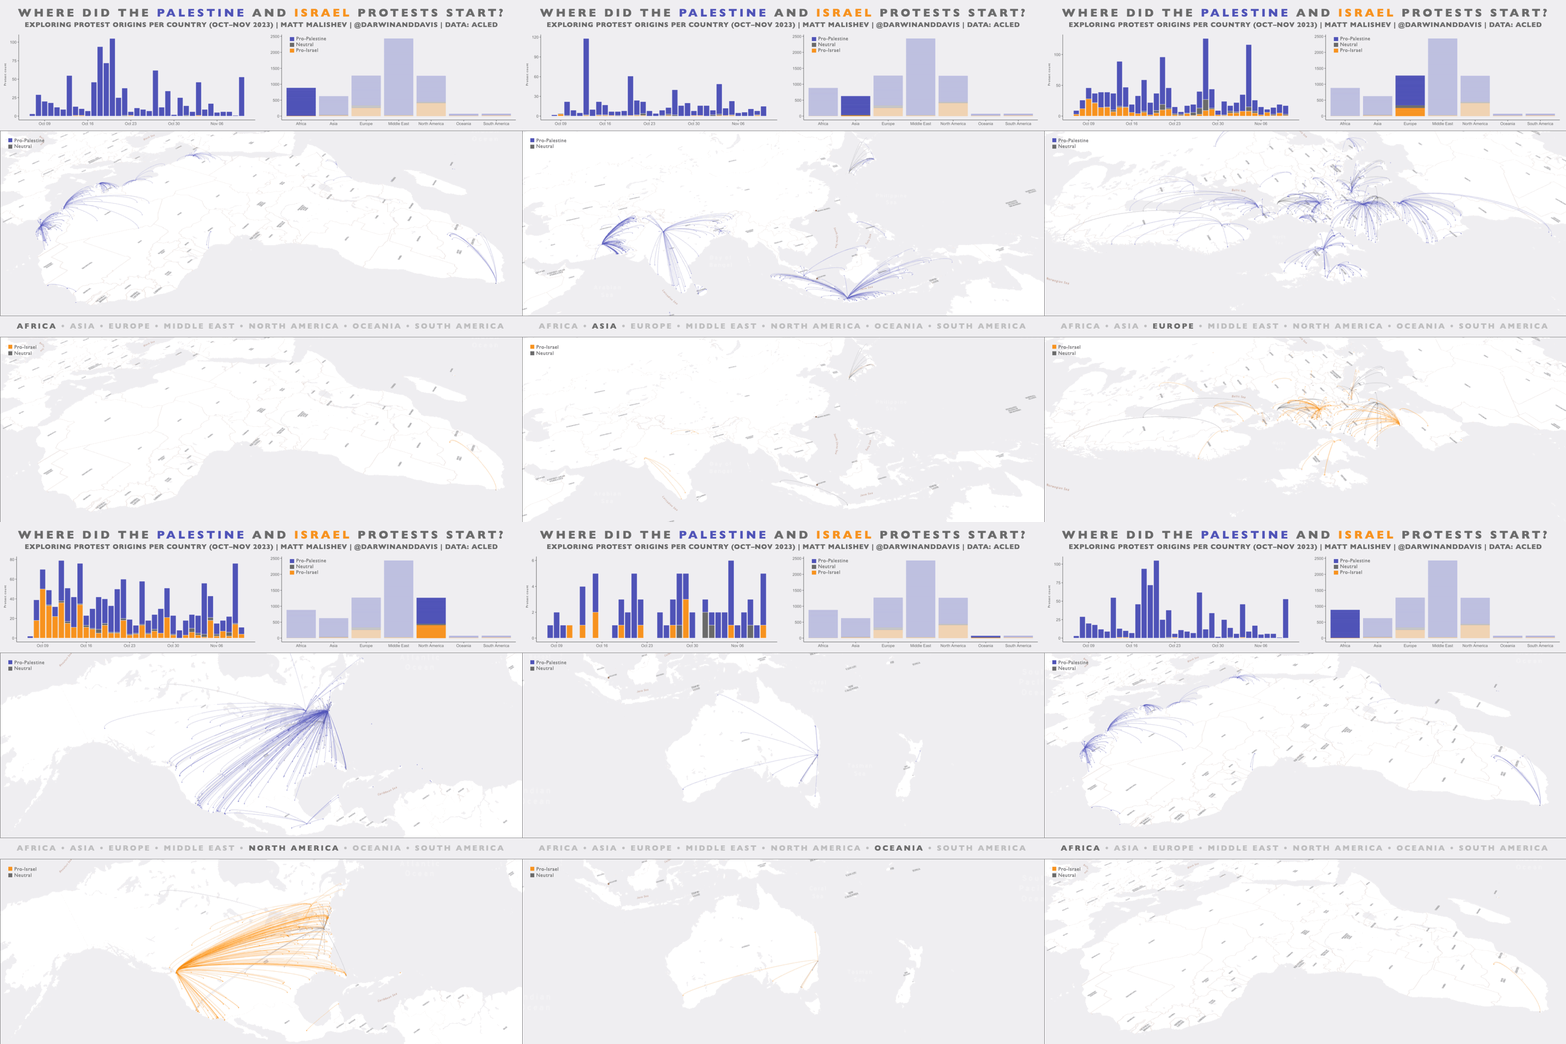
Where did the Palestine and Israel protests start? Exploring protest origins per country using publicly available global protest data

Check out project